Build your own web map from scratch
Welcome
- What is a web map?
- What is Leaflet?
- What are we trying to accomplish today?
Tech Requirements - Overview
- What you need to have installed:
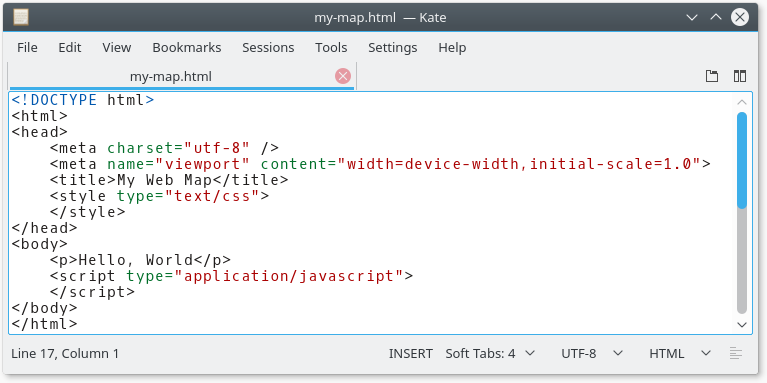
- A simple text editor
- Python
- What you need to do to get started:
- Open your command prompt/terminal
- Start your web server
Tech Requirements - Text Editor
Tech Requirements - Python
- Python: An introduction
- How we'll be using it
- Installing Python:

Tech Requirements - Your Command Prompt
- What is it?
- How to open it

Tech Requirements - Web Server
- What's a web server?
- How we'll be using it

Tech Requirements - Start Your Web Server
- Create a new folder for the Leaflet Workshop (e.g.
Documents/Leaflet_workshop)
- Open your command prompt/terminal
- Navigate to your Leaflet Workshop folder:
cd Documents
cd Leaflet_workshop
-
Start the Python web server:
python -m SimpleHTTPServer
- Open http://localhost:8000 in your web browser
You should now see a web page with "Directory listing for /"
at the top.
It's map time!
- JavaScript - What is it and how we'll be using it
- Four stages:
- Creating a basic web map
- Adding some data
- Visualising the data
- Making the map interactive
Creating a basic web map
- Add these required links to load Leaflet (in the document
<head>, after the <title> section):
<link rel="stylesheet" href="http://cdnjs.cloudflare.com/ajax/libs/leaflet/1.0.3/leaflet.css" />
<script src="http://cdnjs.cloudflare.com/ajax/libs/leaflet/1.0.3/leaflet.js"></script>
- Add this required link to load jQuery (in the document
<head>, after the above section):
<script src="http://cdnjs.cloudflare.com/ajax/libs/jquery/3.2.1/jquery.min.js"></script>
- Add the map itself (in the
<body>):
<div id="map-canvas"></div>
- Add the code to create the map (in the
<body> in between the <script> tags):
$(document).ready(function () {
var map = L.map( 'map-canvas', { center: [-31.95, 115.86], zoom: 11 } );
L.tileLayer('http://{s}.tile.osm.org/{z}/{x}/{y}.png', {
attribution: '© <a href="http://osm.org/copyright">OpenStreetMap</a> contributors'
}).addTo(map);
});
- Add some style to make the map fill the whole screen (in the
<head> in between the <style> tags):
body { padding: 0; margin: 0; }
html, body, #map-canvas { height: 100%; width: 100%; }
You should now have a file similar to stage-1.0-basic-web-map.html.
Adding some data
- Save walibraryaddresses.geojson to your working folder
- Add it to your map with this code:
$.getJSON("walibraryaddresses.geojson", function(geojson) {
    L.geoJSON(geojson).addTo(map);
});
- Add a scale control:
L.control.scale().addTo(map);
You should now have a file similar to stage-2.0-adding-data.html.
Visualising the data
Change the map pins to 8 pixel orange circles:
$.getJSON("walibraryaddresses.geojson", function(geojson) {
    var geojsonMarkerOptions = {
        radius: 8,
        fillColor: "#ff7800",
        color: "#000",
        weight: 1,
        opacity: 1,
        fillOpacity: 0.8
    };
    L.geoJSON(geojson, {
        pointToLayer: function(feature, latlng) {
            return L.circleMarker(latlng, geojsonMarkerOptions);
        }
    }).addTo(map);
});
You should now have a file similar to stage-3.0-visualising-data.html.
Dynamic styling
Now change the markers for libraries with a 'Street Suburb' attribute of South Perth to a larger green circle:
$.getJSON("walibraryaddresses.geojson", function(geojson) {
    var libraryMarker = {
        radius: 8,
        fillColor: "#ff7800", // Orange.
        color: "#000",
        weight: 1,
        opacity: 1,
        fillOpacity: 0.8
    };
    var specialLibraryMarker = {
        radius: 16,
        fillColor: "#0faa9b", // Green
        color: "#fff",
        weight: 1,
        opacity: 1,
        fillOpacity: 0.8
    };
    L.geoJSON(geojson, {
        pointToLayer: function(feature, latlng) {
            var style;
            switch(feature.properties["Street Suburb"]) {
                case "South Perth":
                    style = specialLibraryMarker;
                    break;
                default:
                    style = libraryMarker;
            }
            return L.circleMarker(latlng, style);
        }
    }).addTo(map);
});
You should now have a file similar to stage-3.1-dynamic-styling.html.
Making the map interactive
Now add a popup box so that you can see the library name when you click on the orange circle.
L.geoJSON(geojson, {
    pointToLayer: function(feature, latlng) {
        /* Code here is unchanged */
    },
    onEachFeature: function(feature, layer) {
        if (feature.properties) {
            layer.bindPopup(feature.properties["Name"]);
        }
    }
}).addTo(map);
You should now have a file similar to stage-4.0-adding-popups.html.